

Introduction#
One of the main challenges in developing multiplayer games is the situation where a large number of players gather in one place and can see each other. In this case, the amount of network data grows nonlinearly: each player must receive updates about all others. For example, 100 players already generate around 10,000 individual updates.
Let’s take a look at how Iris differs from the standard replication system. Epic Games describes Iris as:
Iris is an opt-in replication system that works alongside Unreal Engine’s existing replication system. The system builds on Epic’s experience with Fortnite Battle Royale, which supports up to 100 players per server instance. Iris supports robust multiplayer experiences with:
- Larger, more interactive worlds.
- Higher player counts.
- Lower server costs.
Testing Methodology#
The main idea: a small flat map — 2 km × 2 km.
Within an 800-meter radius from the center, 100 players spawn and run toward the center, gradually becoming visible to each other.
We collect metrics and analyze the data.
In the best traditions of stress testing, we disable everything unnecessary:
- Collisions between characters —
Pawncollision profile - Ignore
Cameratrace channel forPawn - Disable skeletal mesh collisions —
CharacterMeshcollision profile
Technical setup:
- Build the Linux server and Linux client.
- Package them into Docker images.
- Rent multiple virtual machines:
- Server: 2 vCPU Intel® Xeon® Processor 6354, 2 GB RAM — on a separate VM.
- Clients: several instances can run on the same VM.
- The server starts with the parameter
-MaxPlayers=101. The game doesn’t begin until 80% of clients are connected. After that,GameState->HandleBeginPlay();is called, and all players rush toward the center of the map. - After ~5 minutes, the server stops, and profiler logs and data are uploaded to S3.
- Finally, all rented VMs are shut down and deleted.
- Download the
*.utracefiles and analyze them using Unreal Insights.
The following will participate in replication:APlayerCharacter, UCharacterMovementComponent, APlayerController, APlayerState, and AGameState.
The main load, of course, comes from APlayerCharacter and UCharacterMovementComponent.
Default Replication System#
An old and familiar friend — with us since Unreal Engine 4.
Its behavior could be customized using the Replication Graph, allowing developers to control who replicates what and when.
However, we won’t be covering Replication Graph here, as it’s considered deprecated, and the default implementation serves more as an example than a ready-to-use production solution.
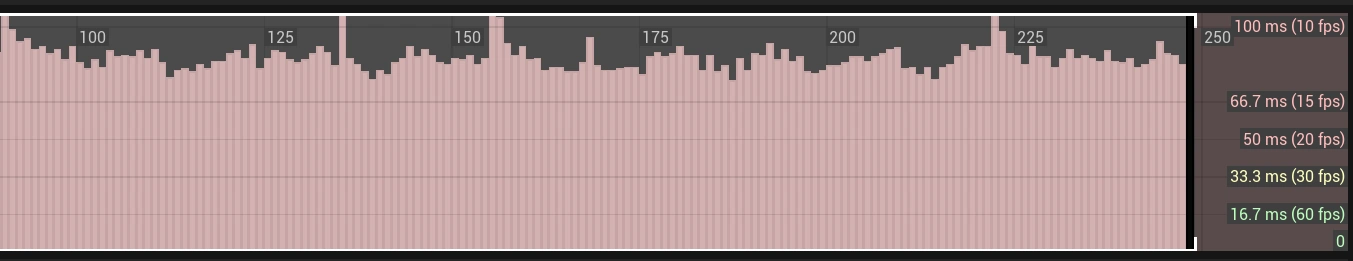
We can see that the frame rate averages between 10 and 15 FPS — and this is just simple movement. Let’s pick a frame with an average value and look inside.
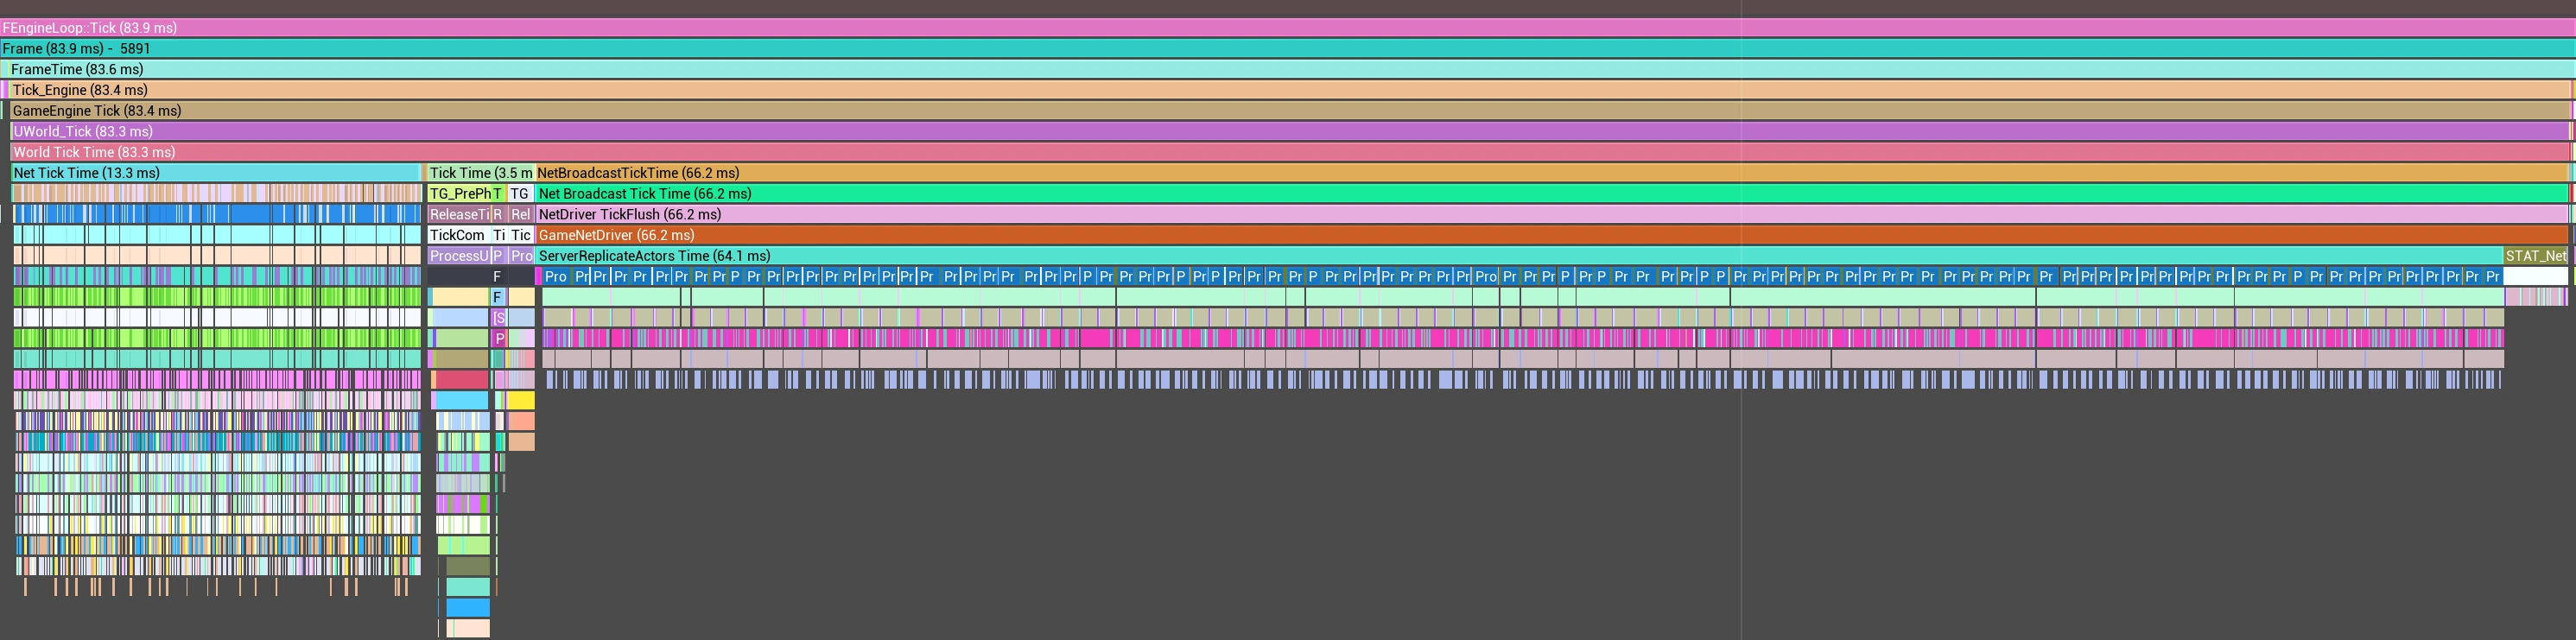
Let’s highlight three main categories within FEngineLoop::Tick (83.9 ms):
- Net Tick Time (13.3 ms) — processing and parsing incoming RPC data
- Tick Time (3.5 ms) — ticking game logic and physics
- NetBroadcastTickTime (66.2 ms) — preparing and sending outgoing data, checking for changes in the internal state of replicated objects.
Net Tick Time (13.3 ms)#
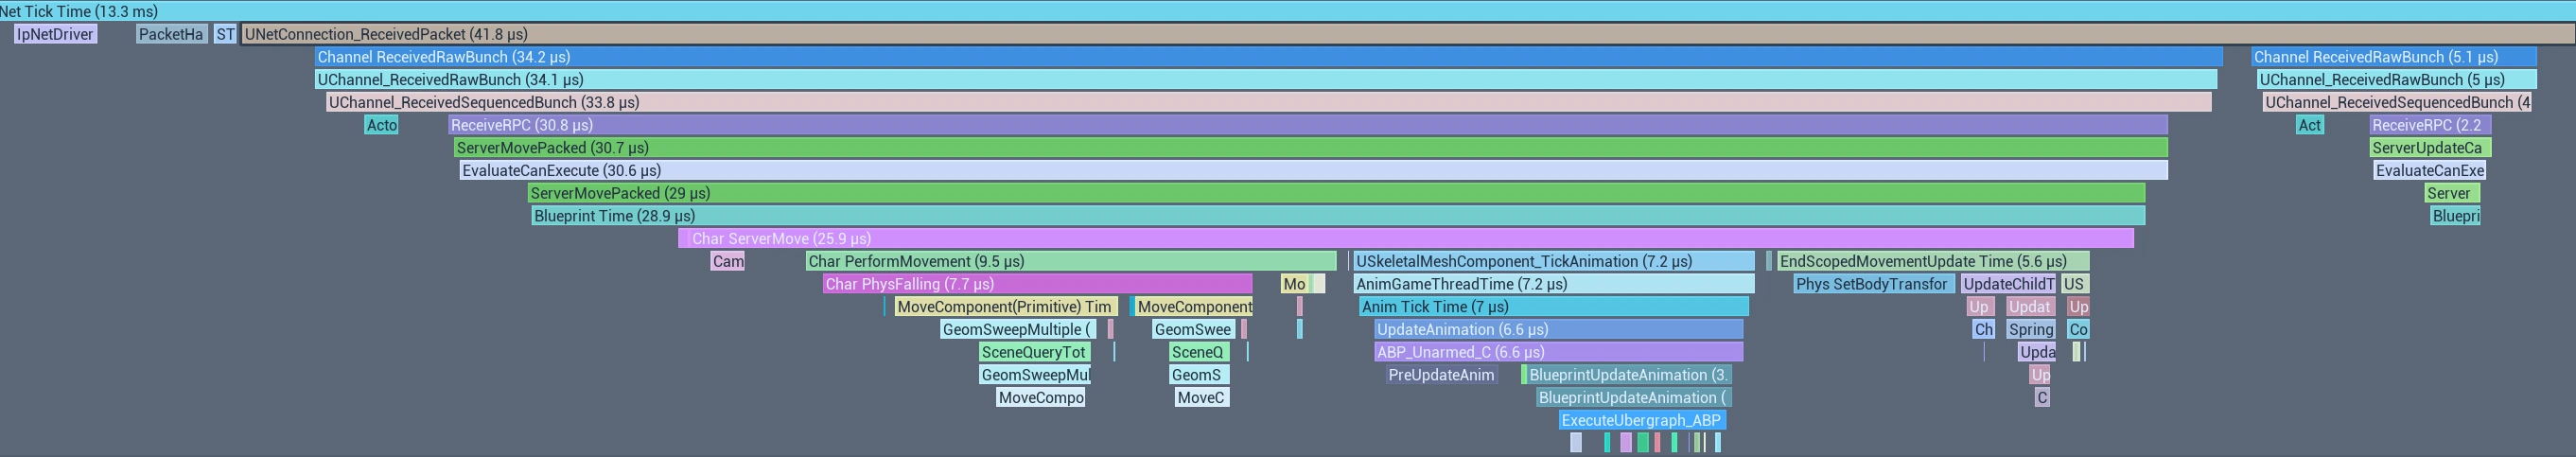
Everything below Blueprint Time (28.9 µs) represents RPC function calls that are not directly related to the replication system. These are final implementations of gameplay logic for specific components — in this case, UCharacterMovementComponent. To the right, there’s another RPC call — ServerUpdateCamera (2.2 µs) — where APlayerController sends the camera position and rotation.
In this tick, the total Blueprint Time inside Net Tick Time (13.3 ms) was 8.5 ms, or about 64%.
Tick Time (3.5 ms)#
From the replication perspective, nothing particularly interesting happens here: actors and components tick, and physics calculations are performed. The main time consumer in our case is SkinnedMeshComp Tick — its execution time directly depends on how heavy the Animation Blueprint is (in our case, it’s Manny_Simple from the standard Unreal Engine 5 set).
USpringArmComponent ticks even on a dedicated server and traces geometry for camera collisions. It takes about 0.8 ms. And since it’s attached to the capsule, during Char PerformMovement, both USpringArmComponent and UCameraComponent are updated — another 0.17 ms. In total, about 1 ms is wasted, even though the camera position is sent through APlayerController, meaning USpringArmComponent isn’t needed on the server at all.NetBroadcastTickTime (66.2 ms)#
Here, Process Prioritized Actors is called for each client, and within it, Replicate Actor is executed for every relevant actor. This means that in this tick, Process Prioritized Actors is called 101 times: 100 virtual clients + 1 observer client. Replicate Actor is called more than 100 times — 101 times for ACharacter, once for APlayerController, several times for AGameState and APlayerState, and for all other gameplay entities.AGameState and APlayerState are not replicated to all clients every tick because NetUpdateFrequency controls how often they should be updated.
AGameState— frequently replicatesdouble ReplicatedWorldTimeSecondsDouble;APlayerState— frequently replicatesuint8 CompressedPing;
At the end, NetDriver_TickClientConnections (2.1 ms) is called, which sends all the prepared packets to the network socket.
Iris Replication System#
Enable the Iris Plugin, configure it in DefaultEngine.ini, and add it as a C++ dependency:
;; DefaultEngine.ini
[SystemSettings]
net.SubObjects.DefaultUseSubObjectReplicationList=1
net.IsPushModelEnabled=1
net.Iris.UseIrisReplication=1
net.Iris.PushModelMode=1
// MyGame.Build.cs
using UnrealBuildTool;

public class MyGame : ModuleRules
{
	public MyGame(ReadOnlyTargetRules Target) : base(Target)
	{
		PCHUsage = PCHUsageMode.UseExplicitOrSharedPCHs;

		/*
			PublicDependencyModuleNames...
			PrivateDependencyModuleNames...
		*/

		SetupIrisSupport(Target);
	}
}
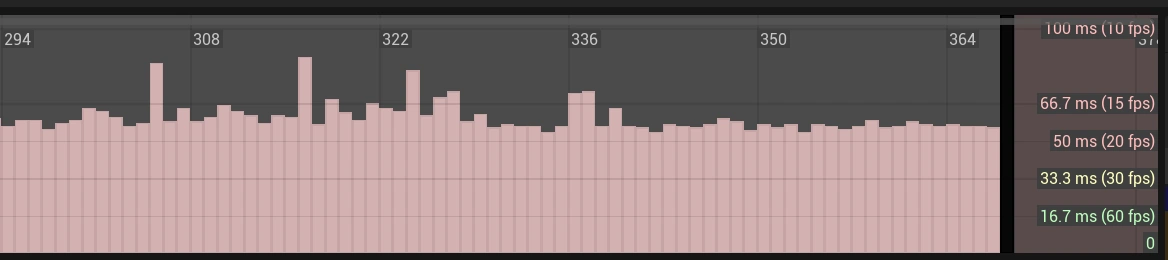
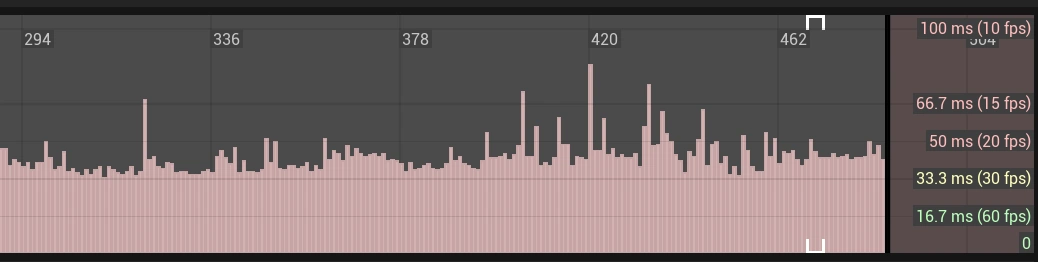
The first thing that stands out is that the FrameTime graph is much smoother, staying within the 15–20 FPS range.
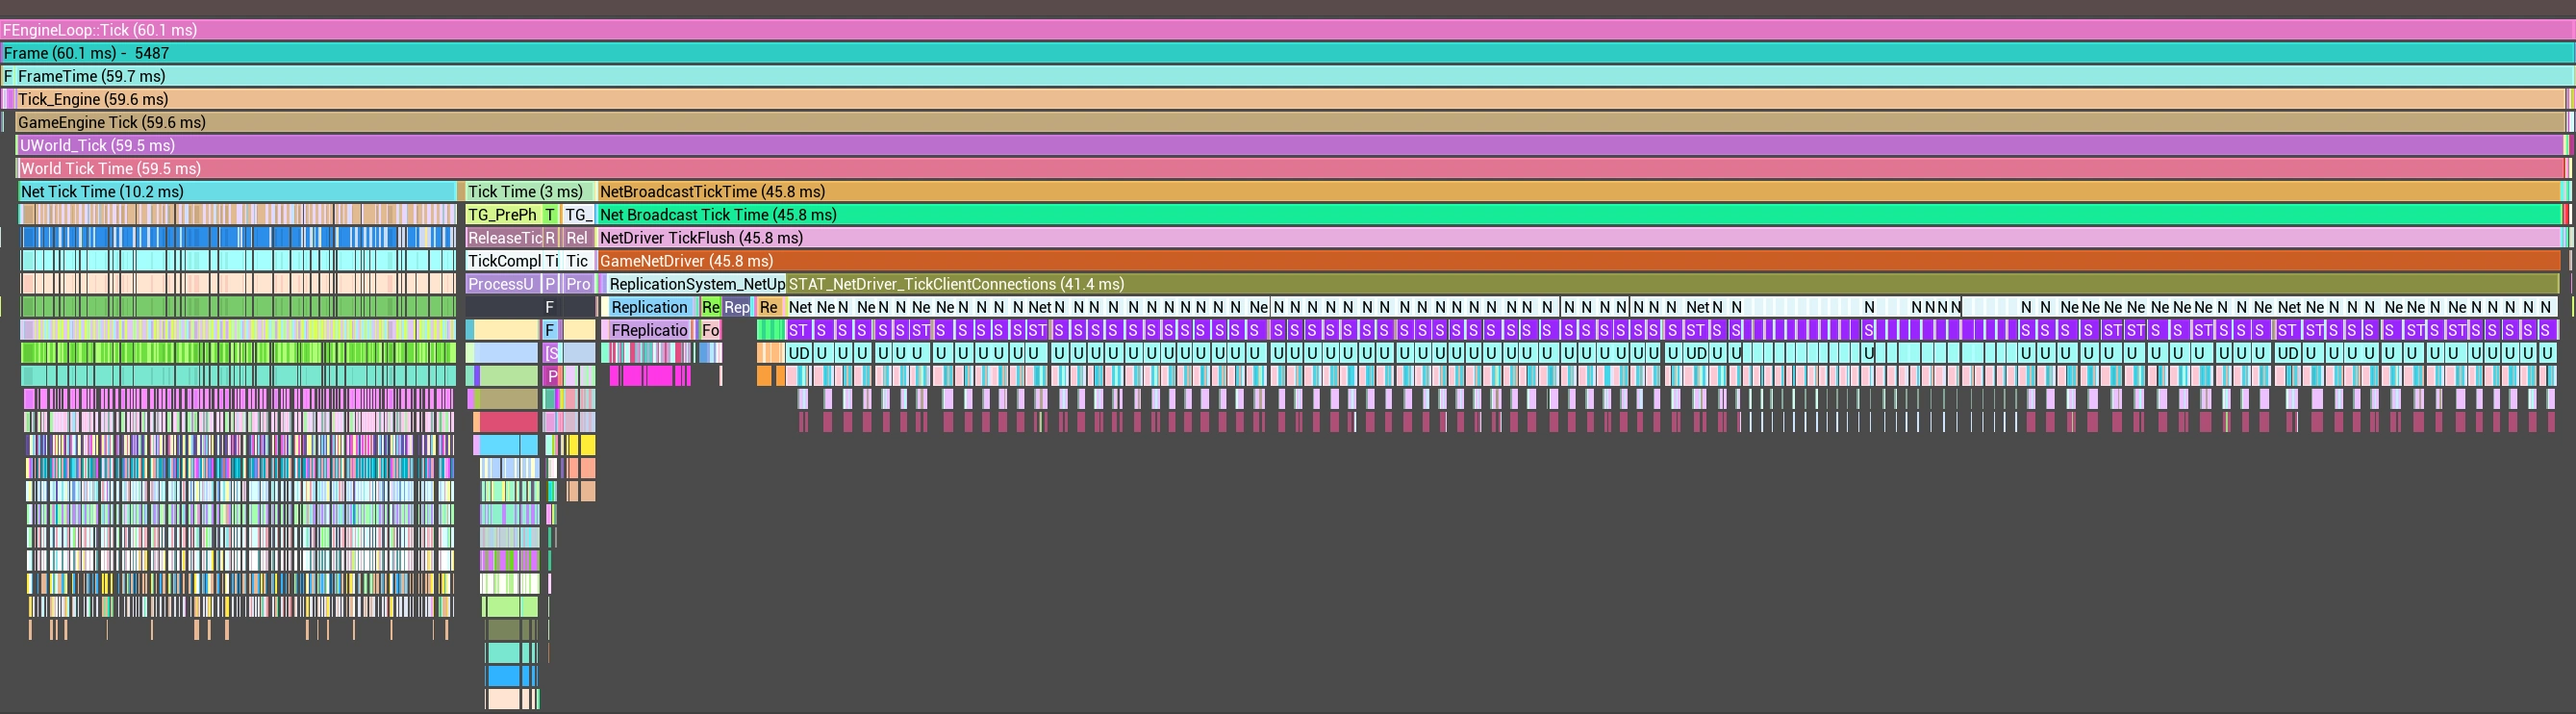
Let’s look at the changes in FEngineLoop::Tick (83.9 ms → 60.1 ms) = 23.8 ms:
- Net Tick Time (13.3 ms → 10.2 ms) = 3 ms (~23%)
- Tick Time (3.5 ms → 3 ms) = 0.5 ms — I don’t think this improvement is due to Iris.
- NetBroadcastTickTime (66.2 ms → 45.8 ms) = 20.4 ms (~30%)
Not bad for just two lines in the config.
We can draw an analogy with the previous implementation: NetConnection Tick is called once per client — that’s 101 calls in this frame.
Inside FReplicationWriter_Write, all the changes that each client should receive are written. There are two calls to FReplicationWriter_Write here — most likely because data is written until the buffer is full. Once it’s full, the data is sent to the socket. But since there’s still more data to send, a second packet is created and sent at the end of NetConnection Tick.
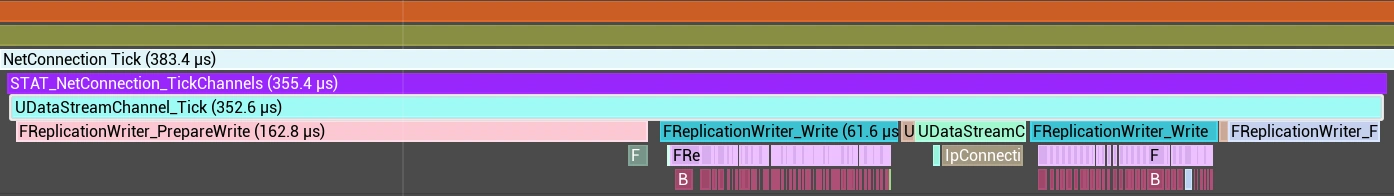
It can be seen that FReplicationWriter_PrepareWrite and FReplicationWriter_FinishWrite consume more than half of UDataStreamChannel_Tick, even though, logically, most of the work should occur inside FReplicationWriter_Write.
struct FScheduleObjectInfo
{
	uint32 Index;
	float SortKey;
};

UDataStream::EWriteResult FReplicationWriter::BeginWrite(const UDataStream::FBeginWriteParameters& Params)
{
	IRIS_PROFILER_SCOPE(FReplicationWriter_PrepareWrite);

	// ... code ... code ...

	// $IRIS TODO: LinearAllocator/ScratchPad?
	// Allocate space for indices to send
	// This should be allocated from frame temp allocator and be cleaned up end of frame, we might want this data to persist over multiple write calls but not over multiple frames
	// https://jira.it.epicgames.com/browse/UE-127374
	WriteContext.ScheduledObjectInfos = reinterpret_cast<FScheduleObjectInfo*>(FMemory::Malloc(sizeof(FScheduleObjectInfo) * NetRefHandleManager->GetCurrentMaxInternalNetRefIndex()));
	WriteContext.ScheduledObjectCount = ScheduleObjects(WriteContext.ScheduledObjectInfos);
}

void FReplicationWriter::EndWrite()
{
	IRIS_PROFILER_SCOPE(FReplicationWriter_FinishWrite);

	// ... code ... code ...

	FMemory::Free(WriteContext.ScheduledObjectInfos);
	WriteContext.ScheduledObjectInfos = nullptr;
	WriteContext.bIsValid = false;
}
sizeof(FScheduleObjectInfo) = 8 bytes, and GetCurrentMaxInternalNetRefIndex() = 65,535. In total, 524,280 bytes are allocated and freed 101 times per frame.
Since ScheduledObjectInfos is used only as a temporary buffer for indices, I wrote code so that UReplicationSystem holds the memory pointer, while FReplicationWriter simply uses it. There’s also a chance that GetCurrentMaxInternalNetRefIndex() may change — I handled that case as well. Because the original code uses FMemory::Malloc, there’s no need to manually clear the memory afterward. The data in ScheduledObjectInfos is first written, and only then read.
Here’s what it looks like:
void FReplicationWriter::SetNetObjectListsSize(FInternalNetRefIndex NewMaxInternalIndex)
{
	// ... code ... code ...
	ReplicationSystemInternal->ReserveScheduledObjectIndices(sizeof(FScheduleObjectInfo) * NewMaxInternalIndex);
}

UDataStream::EWriteResult FReplicationWriter::BeginWrite(const UDataStream::FBeginWriteParameters& Params)
{
	// ... code ... code ...
	WriteContext.ScheduledObjectInfos = static_cast<FScheduleObjectInfo*>(ReplicationSystemInternal->GetScheduledObjectIndices());
	WriteContext.ScheduledObjectCount = ScheduleObjects(WriteContext.ScheduledObjectInfos);
}
Patched Iris Replication System#
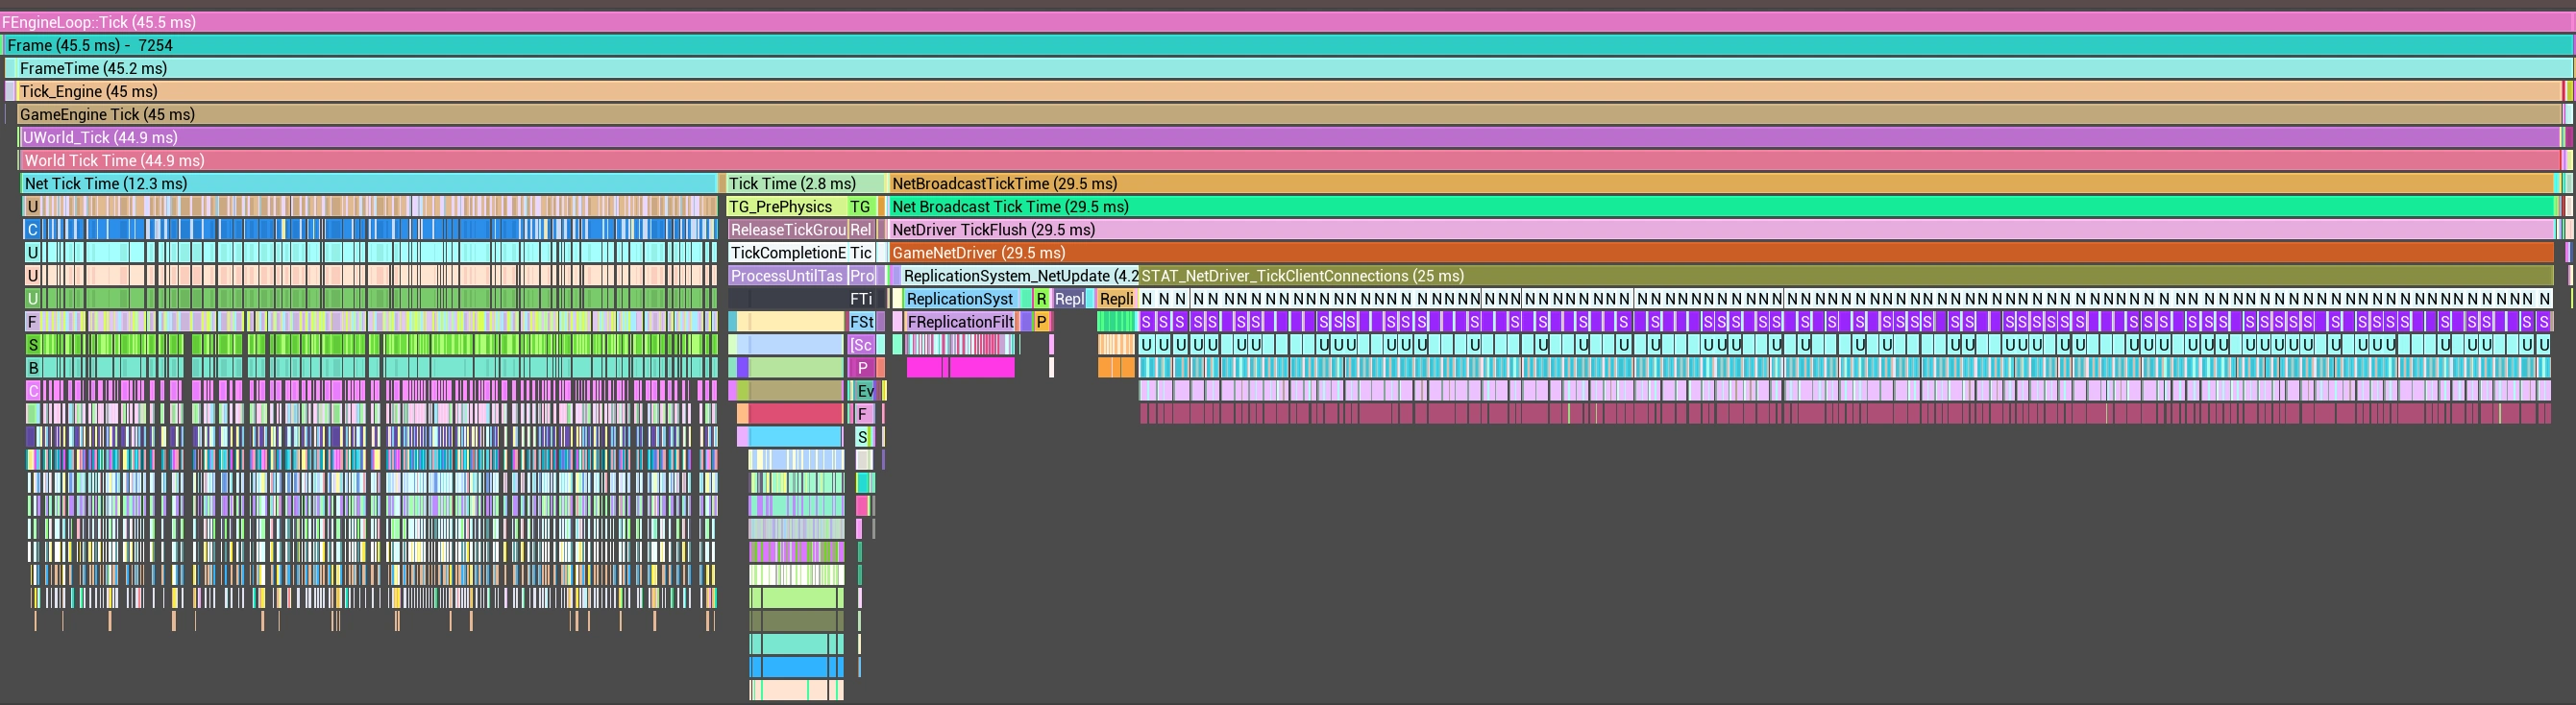
- NetBroadcastTickTime (66.2 ms → 29.5 ms) = 36.7 ms (~55%)
Final Shipping Tests#
I enabled CsvProfiling support for the Shipping build. Then, I increased the server tick rate to 120 FPS.
[/Script/OnlineSubsystemUtils.IpNetDriver]
NetServerMaxTickRate=120
Conclusions#
- Iris provided a 31% higher FrameRate and 24% lower FrameTime in this scenario.
- Both systems performed well under these conditions.
- Always measure performance in environments that are as close to real-world conditions as possible.
- Unreal Insights consumes a significant amount of resources:
-TraceFile -Trace=Cpu,Net -NetTrace=1 -StatNamedEvents. - Disable ticking or remove
USpringArmComponenton a Dedicated Server. - The higher the server tick rate, the more outgoing traffic it generates. For example, in a 5-minute test at 30 FPS, the outgoing traffic reached about 600 MB, while at 70+ FPS it climbed to around 900 MB.
Honestly, I expected a different result. The experiments should continue — adding more replicated entities and making the scenario closer to a real gameplay situation.